Usability Testing of Bus Shuttle Application
Overview
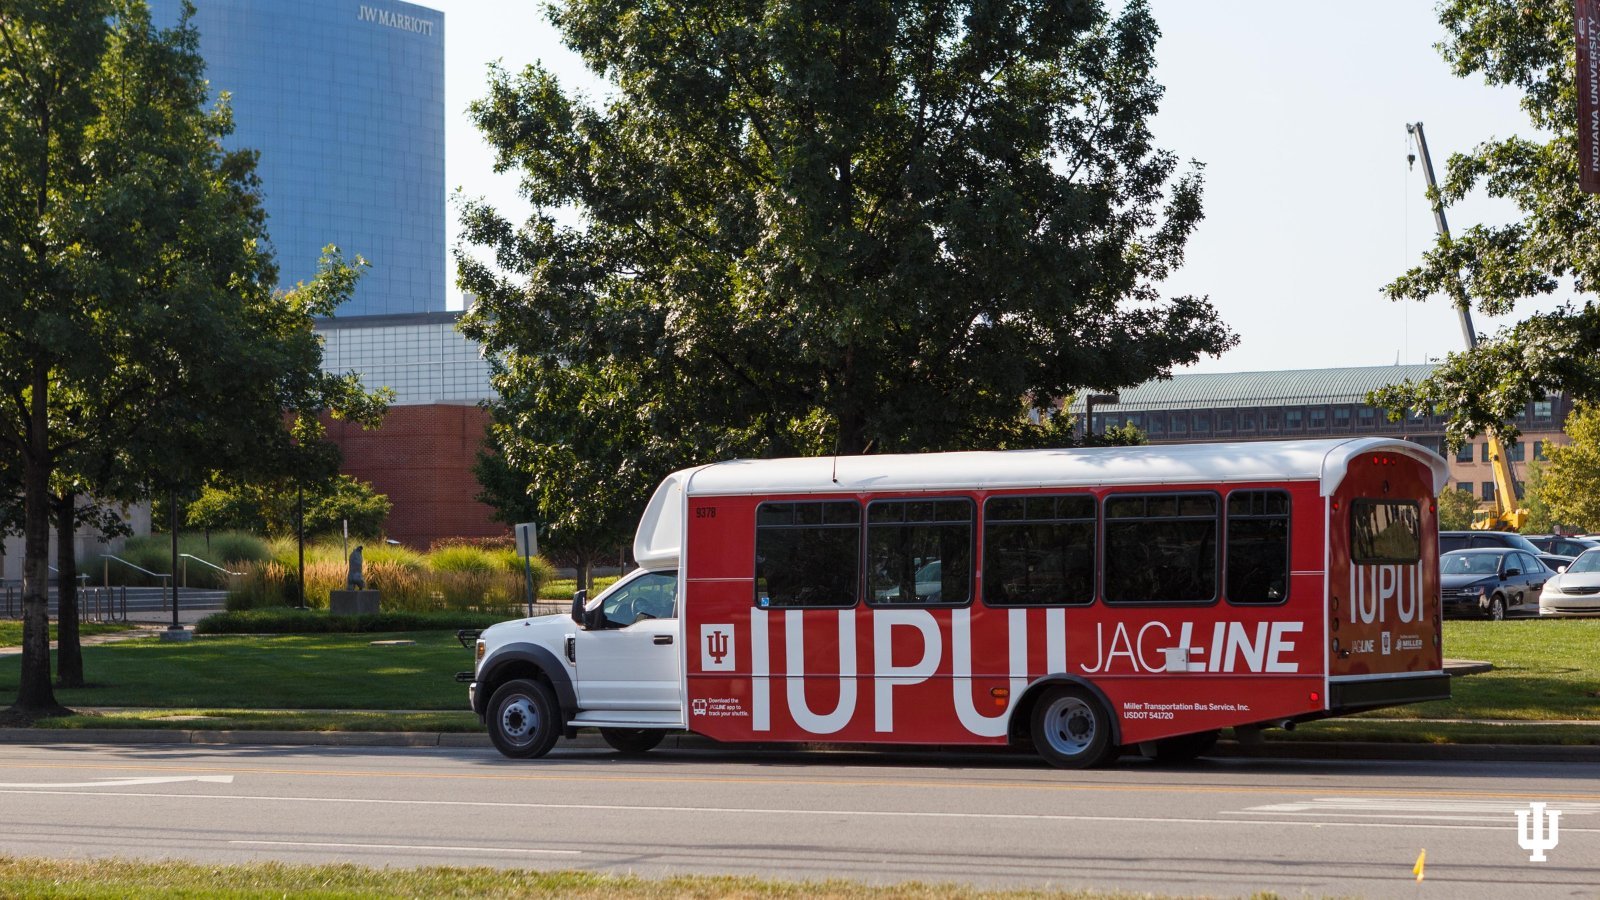
Jagline is IUPUI’s shuttle service, which enables commuters to commute within the camps. The shuttle service has a mobile application geared to help commuters.
I conducted an evaluation research study of that application to identify the issues and provide design recommendations.
Responsibilities
Contribution
As the project's co-leader, I was responsible for end-to-end research activities ranging from crafting research objectives to providing design recommendations.
Collaborators
1 UX Researcher + IUPUI’s IT Team
Duration
6 weeks
Project Type
Evaluative Research | Industry+Academic Project
The Problem
IUPUI’s Bus Shuttle service, ‘Jagline’ had dropped ~50% ridership after the Covid-19 pandemic. The university wanted to bring back the ridership as it was facing losses by running empty shuttles.
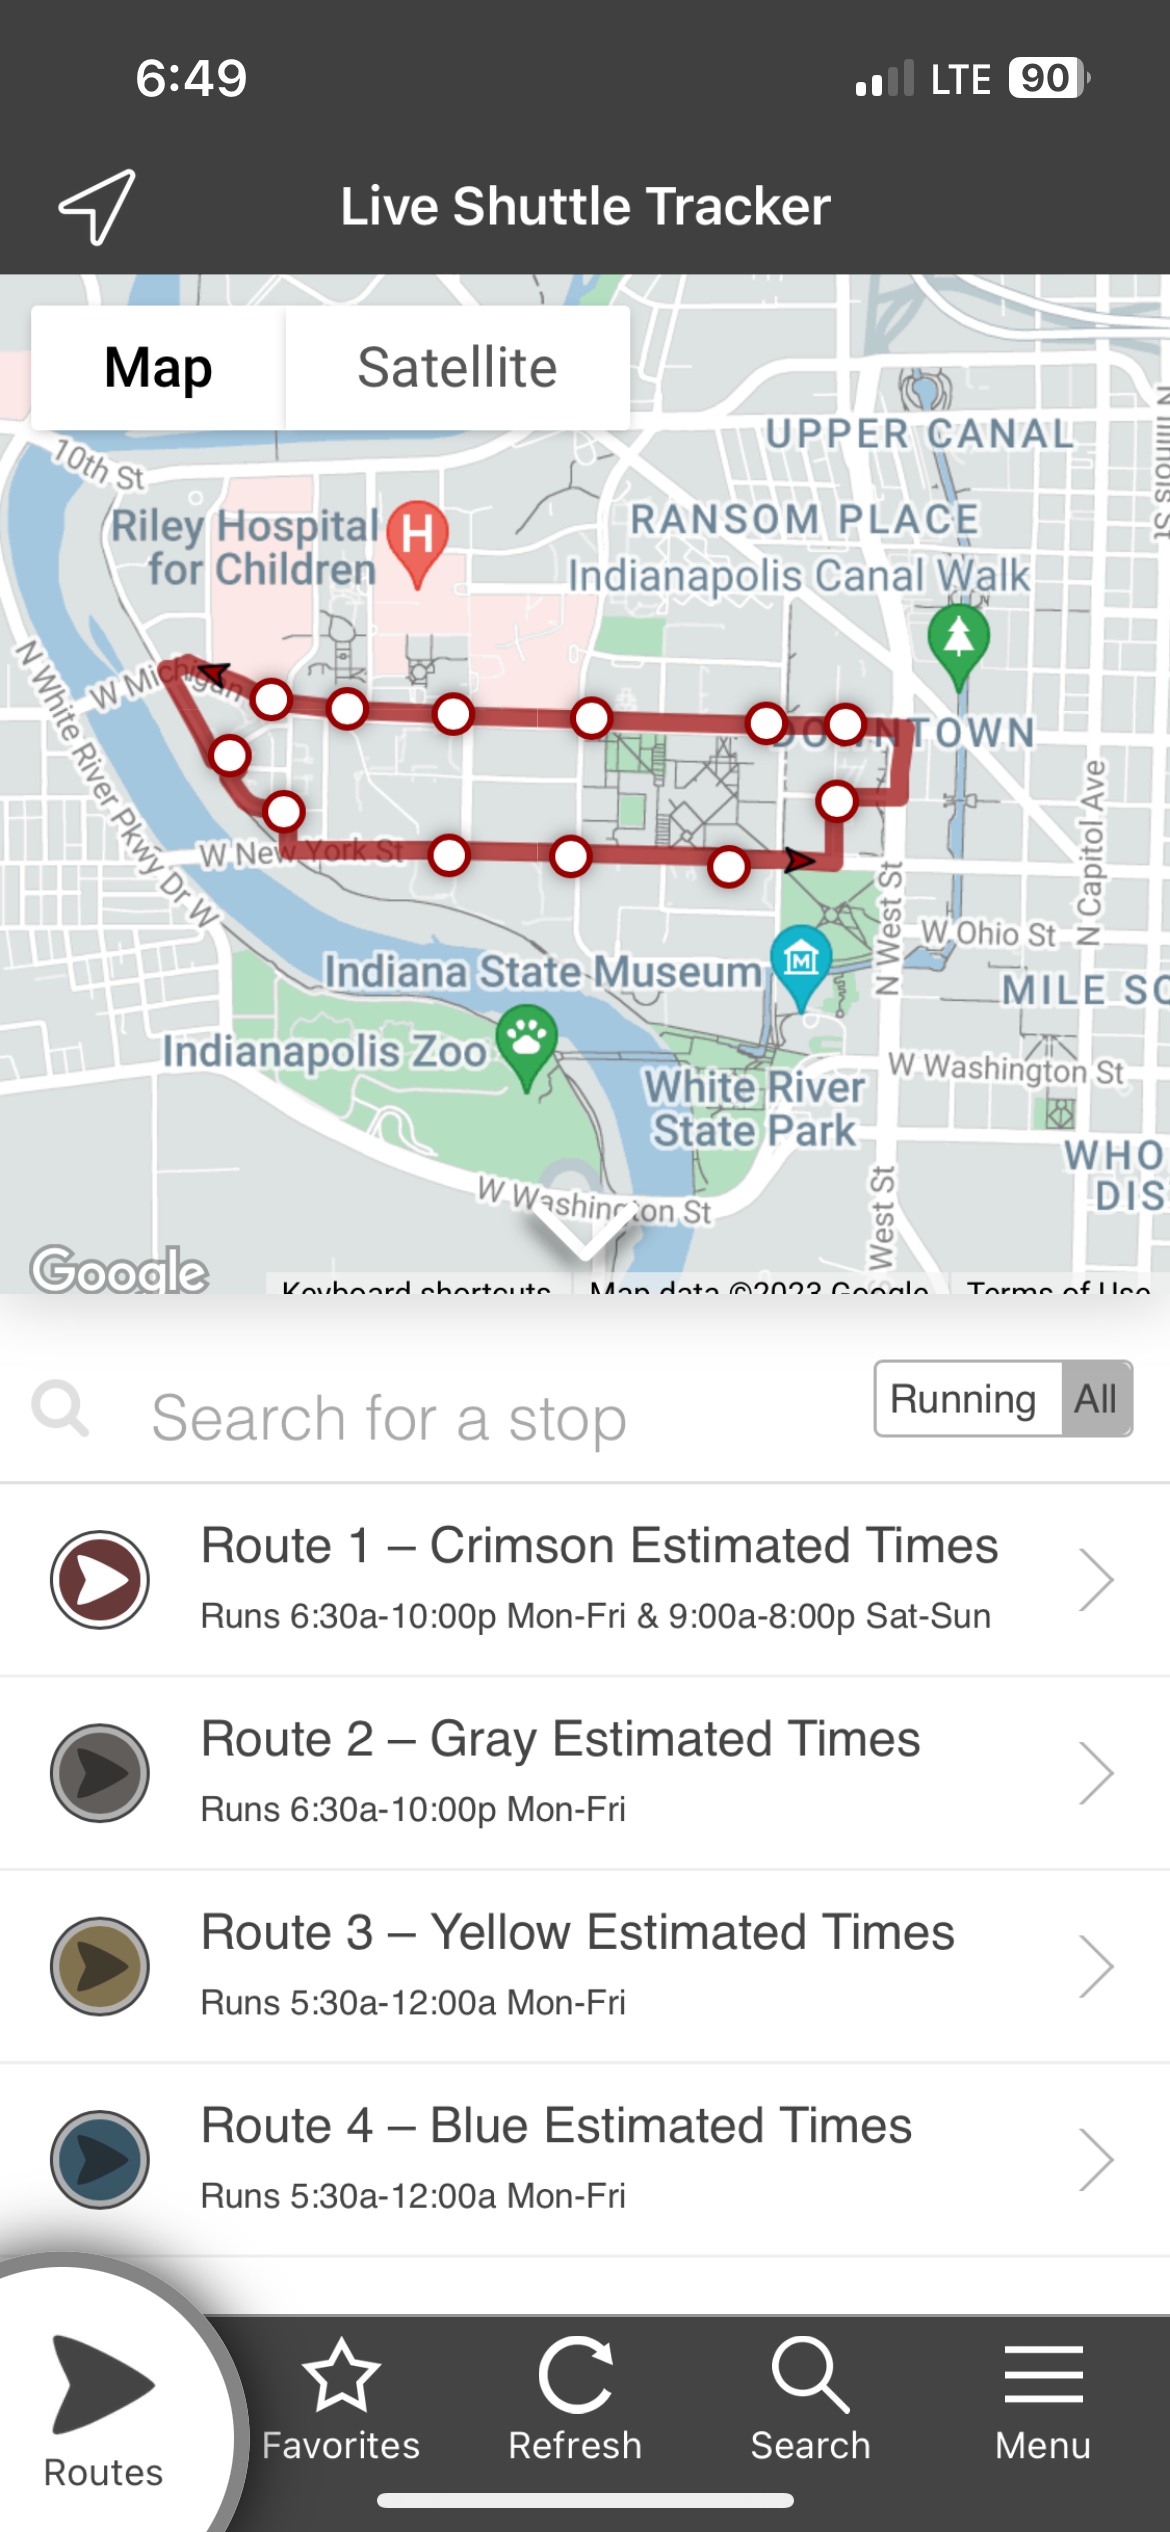
One of the reasons documented by the IUPUI’s team for the low ridership was the inefficient and outdated mobile application.
Therefore, I decided to conduct an evaluative research study of the existing application to discover inefficiencies and provide actionable recommendations.
Research Goals
Since we could not access the old documents/decision trees in crafting the application, we decided to conduct the study from the ground up. Therefore, the research goal(s) were ;
1. To Identify the different user groups who use the mobile application and the Jagline service
2. To identify the different environments in which the application is used
3. To identify the most frequently used function/feature
4. To pinpoint the overall usability issues with the application (not task-specific)
The Research
I.Contextual Inquiry: Understanding the user in their environment.
Contextual inquiry was the most appropriate research method to answer the above research questions. Therefore, I conducted 10 on-field interviews, observations, and implemented methods, such as environment analysis.

fig 1 : Contextual Inquiry
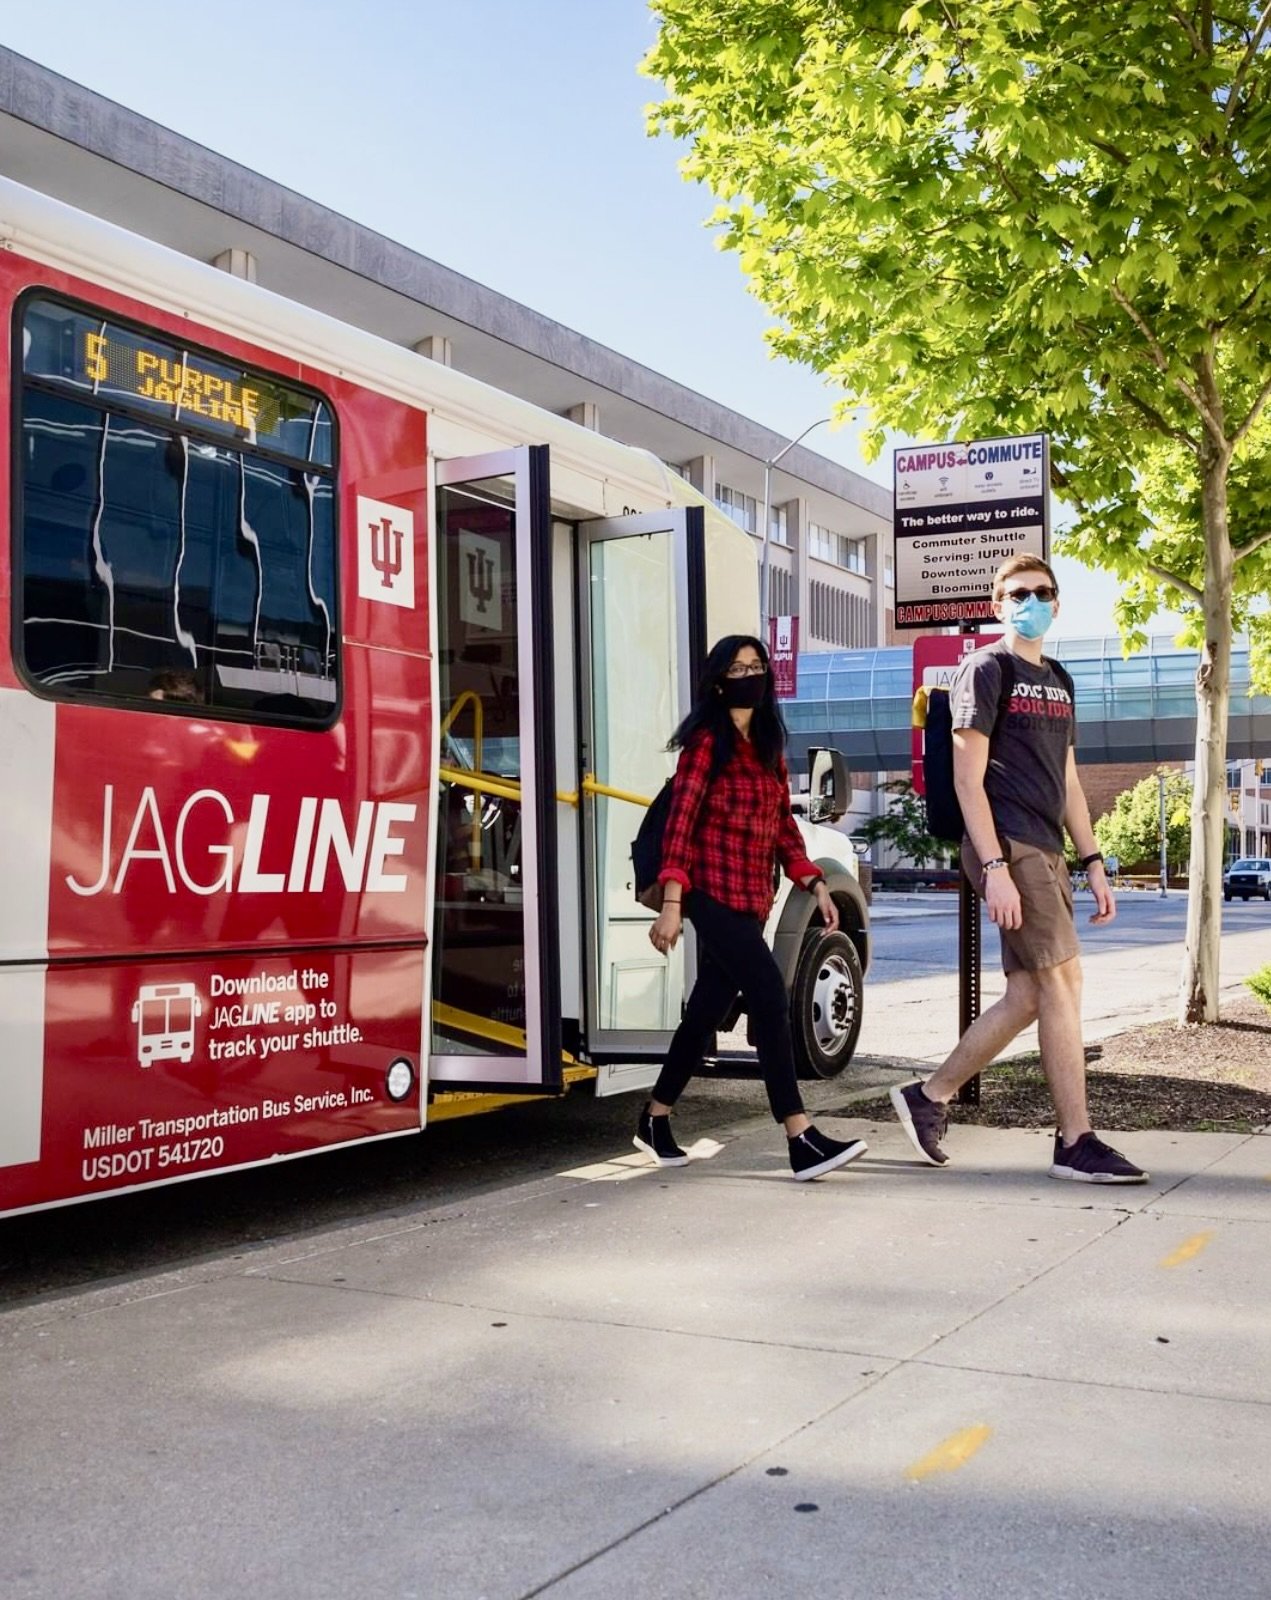
fig 2 : Contextual Inquiry
Insights from Contextual Inquiry
A.Personas
Contextual Inquiry pointed out that there are two types of users of the service and the mobile application, those being;
New User

Seasoned Users

B.User Problems & Quotes
ISSUE 01.
Inefficient Onboarding
P3 ‘My friend recently shared how to locate myself on the map. Earlier, I used to zoom in and out to determine where I might be to the nearest stop.’
ISSUE 02.
Lack of custom search
P6 ‘To go to the library, I have to select the camps center as my destination as searching for a library does not show any results.’
ISSUE 03.
Discoverability of ‘Current Location’ button.
P6 ‘I spent 10 minutes exploring the application when I first used it….. I still did not understand it completely.’
C. The Two Primary Tasks
8/10 Users
Selecting a shuttle route and tracking the shuttle’s live location is the main task.
P3 : ‘ I use the application to explore routes and track shuttle’
7/10 Users
Setting a favorite stop to receive notifications of upcoming shuttles.
P8 : ‘I get down as soon as I receive a notification about my favorite stop.’ P8
In-depth Research Goals
With an overall picture in place, we decided to focus on 2 primary tasks that impact users' experience most.
Therefore, the research goals were;
To identify the usability issues in the main tasks(s)
To identify the how many users are able to/can complete the main task(s)
To determine where the application stands in terms of industry standards.
The Research

Using the data from task success rate calculations, the 95% confidence interval for task one suggested that the actual success rate is likely between 31% and 83% - a very wide range suggestive of improving the usability of the application.
Task Two

Similarly, the 95% confidence interval for the second task suggests that the actual success rate is likely between 39% and 89%, again a very wide range suggestive of improving the application's usability.
III: System Usability Score
I decided to calculate SUS for the application to understand how the application fares in terms of industry standards. The additional intent behind calculating SUS was also to have a reference point for future design iterations.


The SUS for 10 participants came out to be 55.5. However, realizing the true population having a different SUS, I calculated the margin of error: Plus or Minus 8.2.
Using this, I figured that we can be confident that the true population SUS is between 63.7% and 47.3%.
With both the values being less than 67%, I deemed the application a failure in terms of industry standards.
I : Heuristic Evaluations and Task Analysis
I conducted heuristic evaluations to scrappily identify the usability issues in the main task quickly flows.
I also conducted task analysis with 10 users to capture any missed usability issues and reinforce my findings from the heuristic evaluation.

fig 3. Images of heuristic evalutions
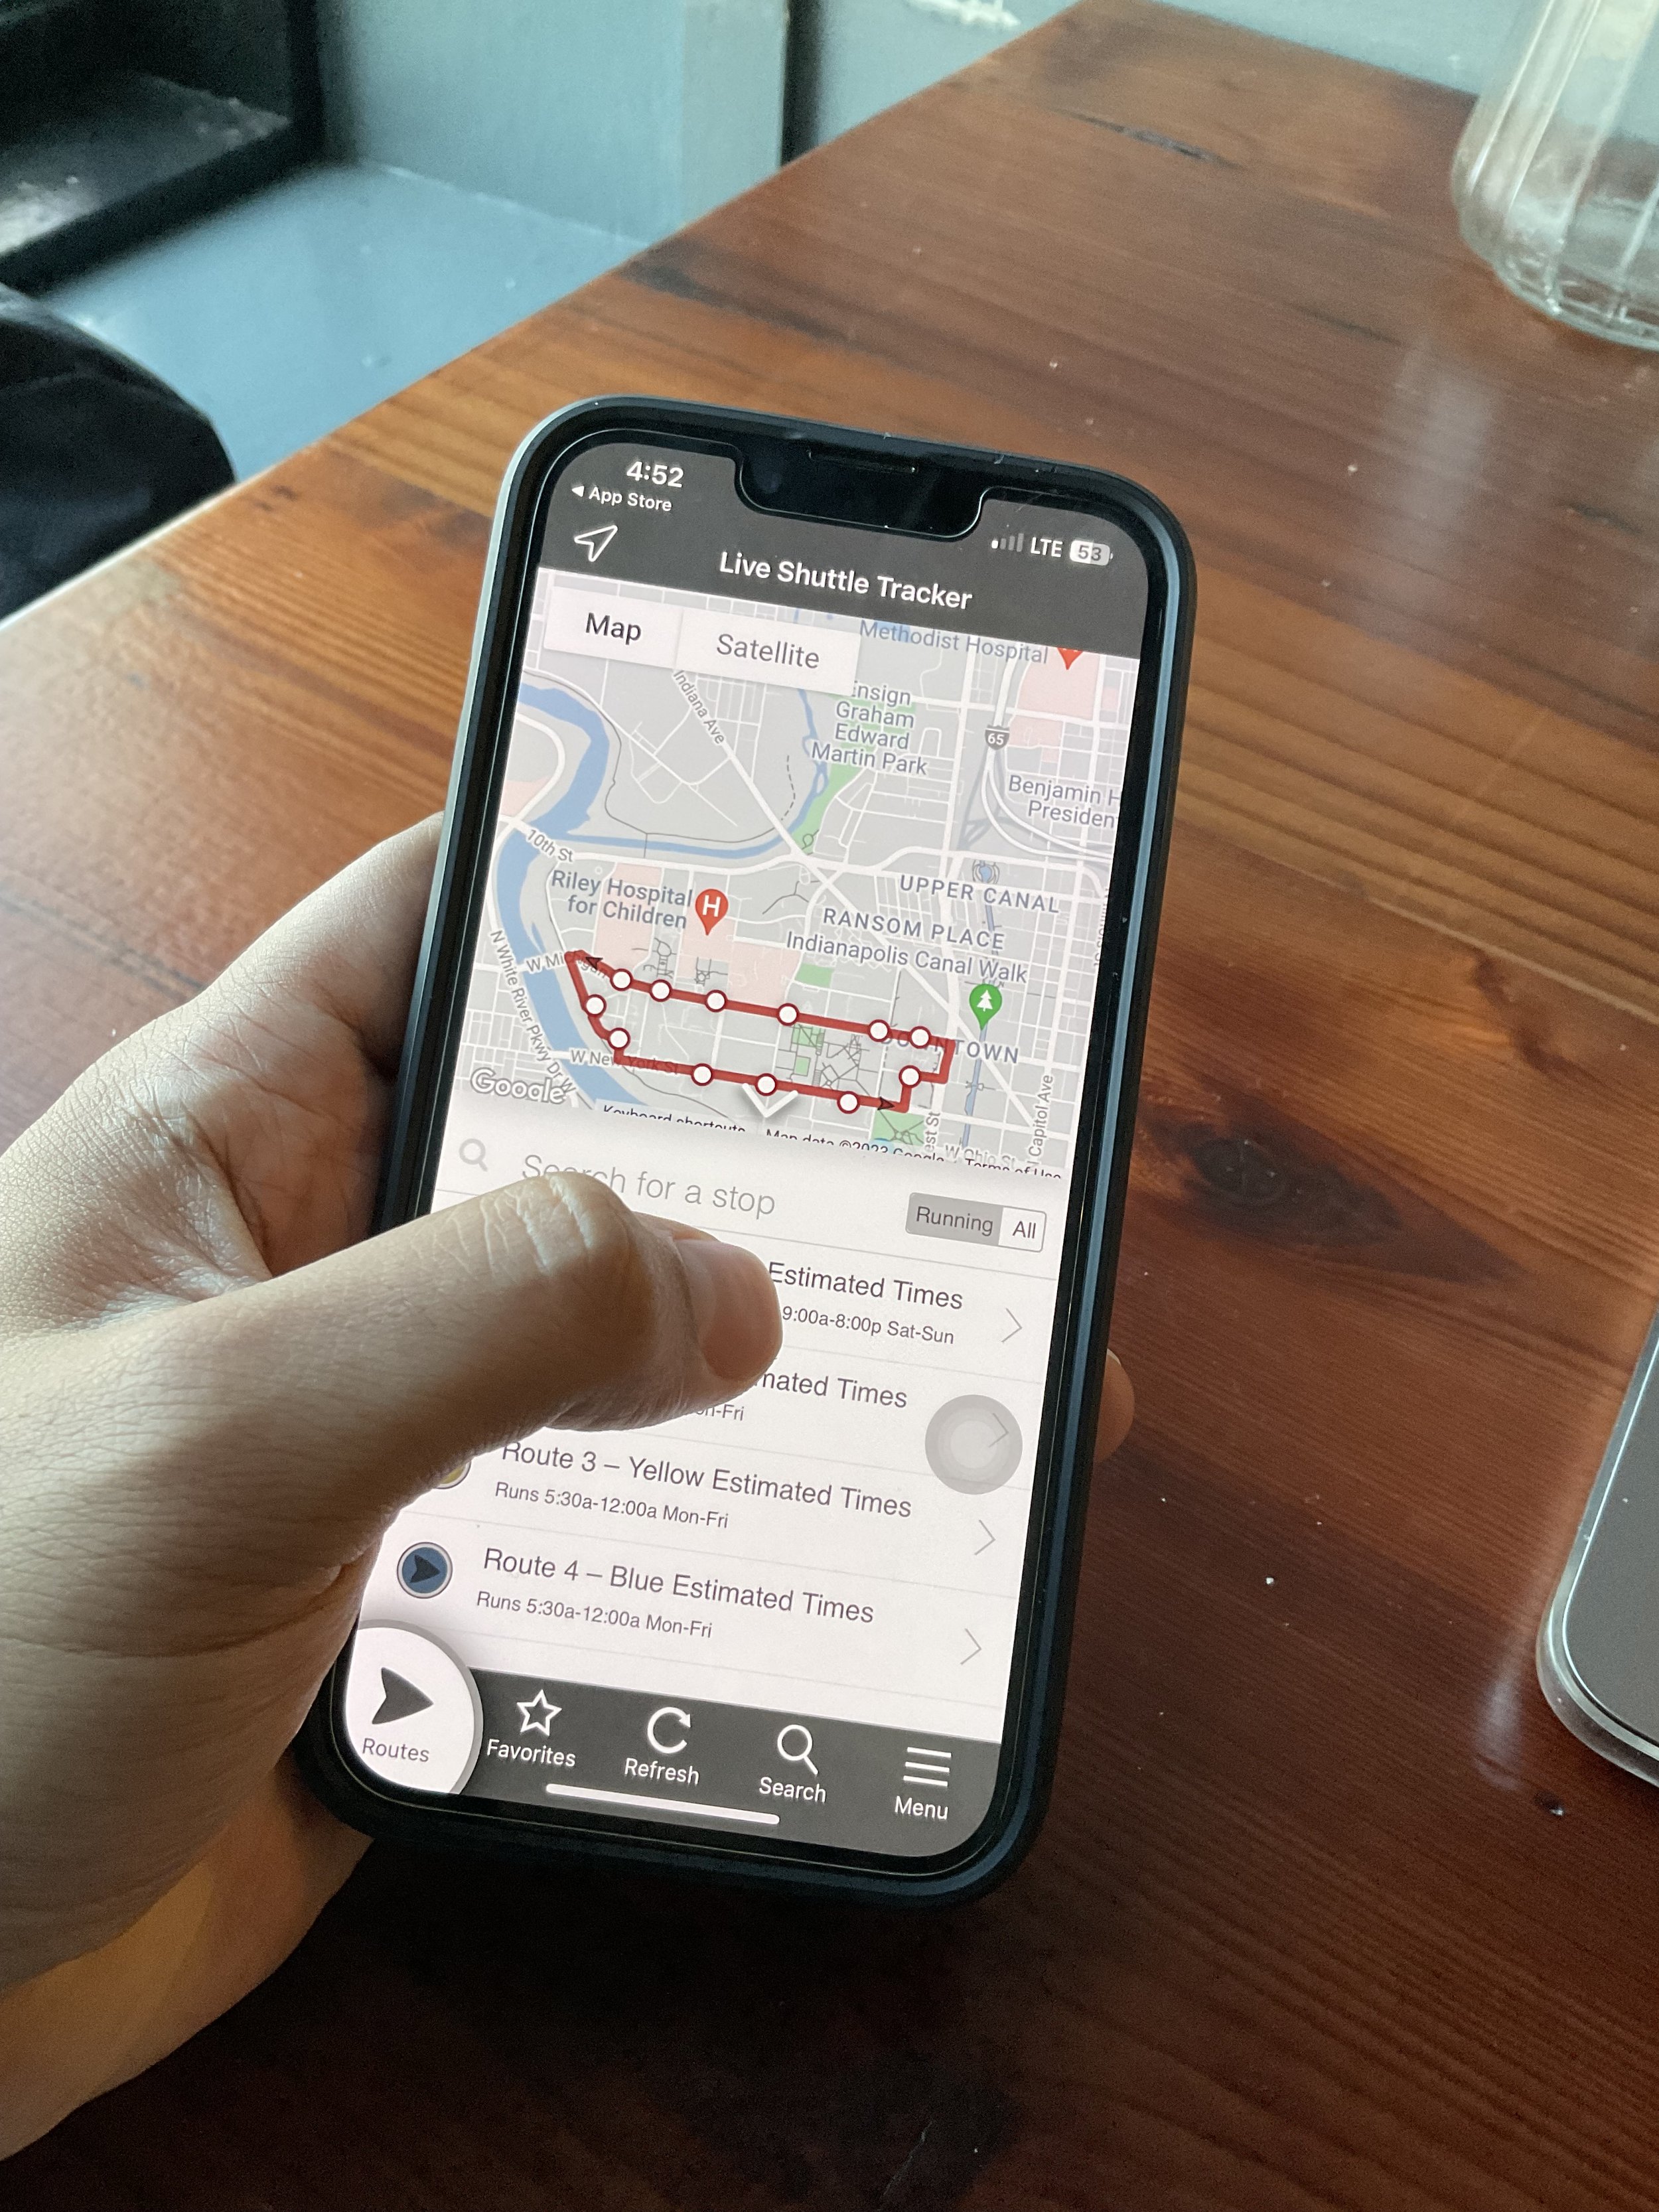
fig 4. Task Analysis
Insights form Heuristic Evaluations & Task Analysis
Following is the list of persistent problems found in both Task Analysis and Heuristic Evaluations
ISSUE 01.
The ‘Current Location’ button in the application is hard to locate.
P2: ‘Usually, there is a locate me button in navigation applications.’
The ‘Current Location’ button is on the top navigation of the application - It violates consistency and standard Heuristic.
Task Analysis
Task Analysis
ISSUE 03.
Selecting a bus stop does not highlight its location/selection on the map/application.
P4 - The User tapped multiple times on the bus stop button to make sure he had selected the correct one.
The visibility of system status is violated while marking a bus stop as a favorite because the selection and location are not highlighted.
Task Analysis
Heuristic Evaluations
ISSUE 02.
Search is restricted to a few preset parameters, viz., bus stop names /street names.
P6: ‘Why am I not able to search for Library?’
Users are not able to search destinations according to their knowledge of the camps.- Violates match between the real world and system Heuristic.
Heuristic Evaluations
Heuristic Evaluations
ISSUE 04.
Users cannot set favorite routes/stops from the favorites tab.
P4: ‘Hmm… is this supposed…allow me to set my favorite stop?’
There is only one way to set a favorite stop, counterintuitively, through route options. This violates the user control and freedom heuristic.
Task Analysis
Heuristic Evaluations
II: Task Success Rate and Confidence Intervals
To gauge the severity of usability issues on task success, I observed task success rates for 10 users during task analysis.
Task Success Rate
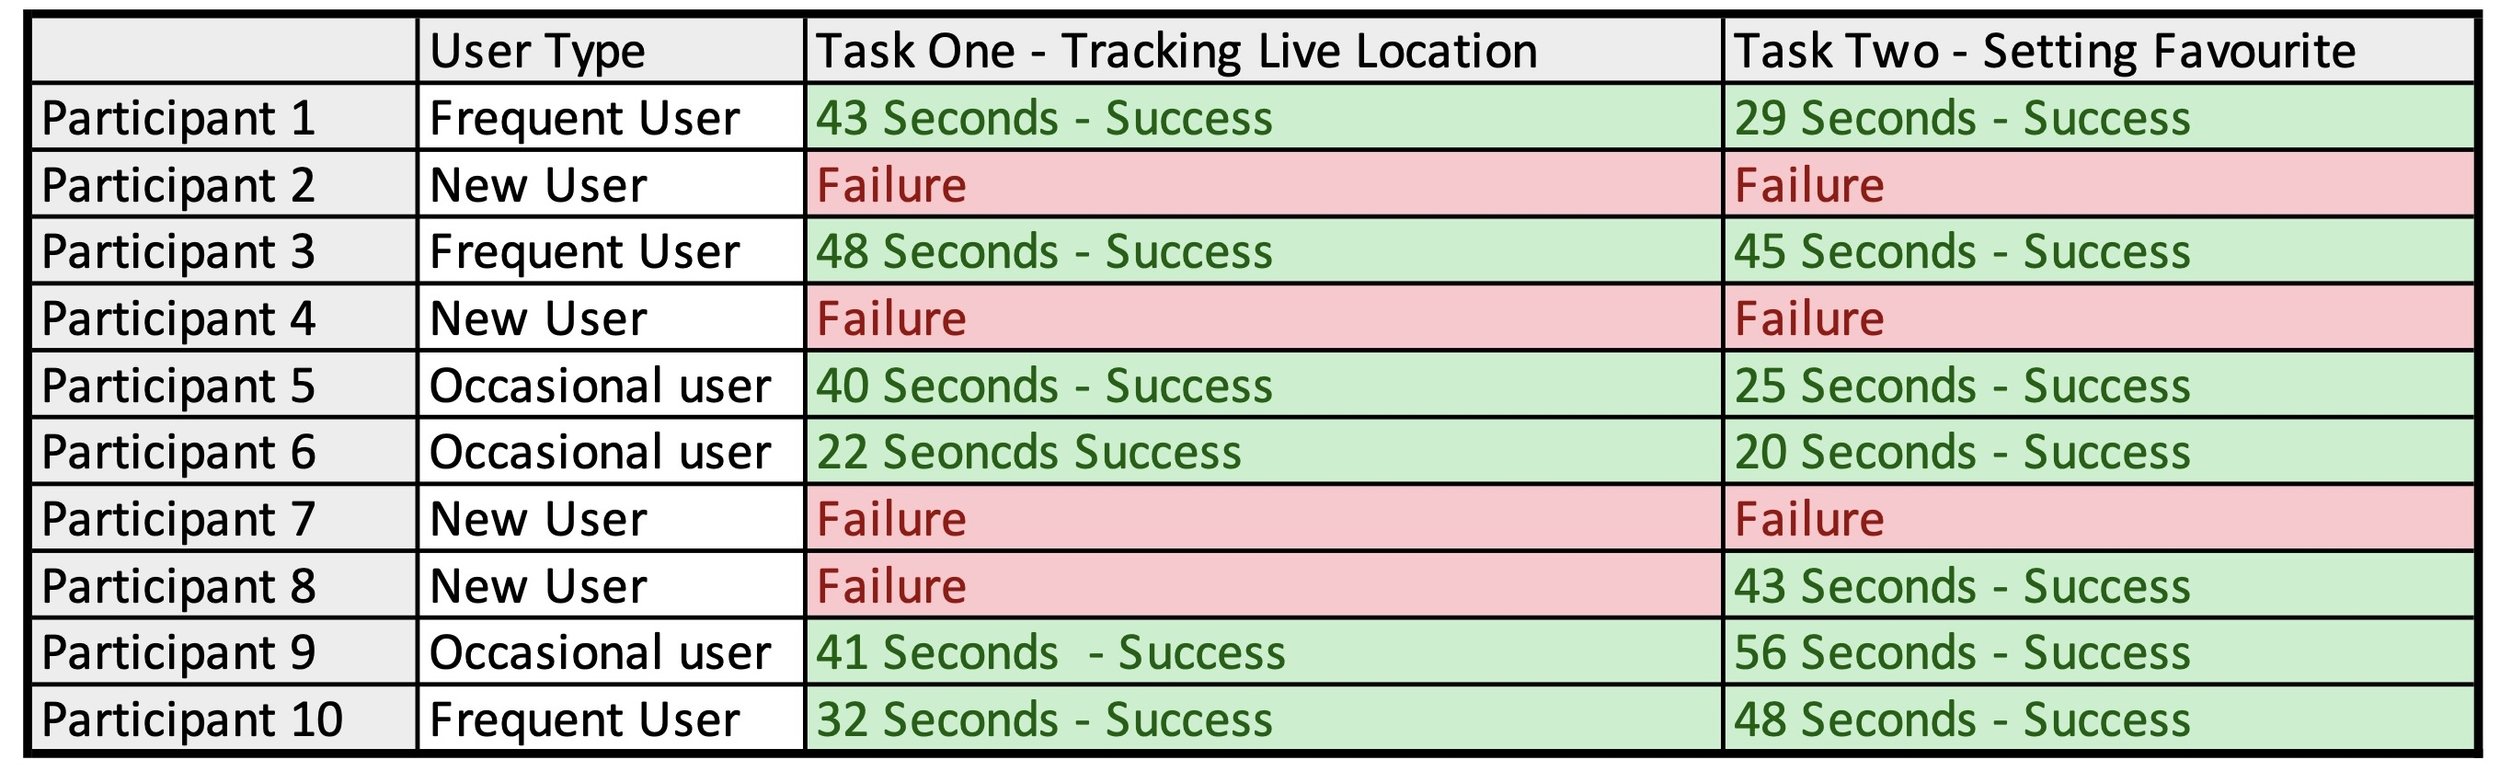
From the observations, we realized the task success rate for the first task was 60%, and for the second task was 70%. This means the usability issues did have a severe impact on the task completion.
Additionally, we realized the task completion for both new users was 0% for the first task and 25% for the second task. This means both tasks were severely difficult for the new users.
Confidence intervals
Realizing that the task success rate for the true population will differ from that of 10 users, I calculated 95% confidence intervals for both tasks.
Task One
Design Recommendation
Based on research findings, I provided IUPUI’s IT team with a list of Recommendations to improve usability.
Sharing a few of those recommendations below;
01.Current Location
The 'current location' button should is the primary feature of any navigation application.
7/10 users failed to locate this button. Therefore, making it discoverable should be one of the top priorities.
03.Favourite Stop + Routes
6/10 users expressed interest in keeping tabs on specific routes instead of shuttle stops. Therefore, adding a way to favorites a route should be prioritized.
Additionally, 5/5 new users opened the favorites tab to mark a shuttle stop. Therefore, marking a favorite route/ stop should be made possible from the favorite tab.
02.Custom Search
5/5 New users searched the final destination according to the landmark they knew and not according to shuttle stop names.
Therefore, having an open search displaying relevant/ nearest stops should be prioritized.
04.Notifications
10/10 Users expressed disappointment with notification timing and expressed notifications are too ‘in the moment’ and hence useless.
Therefore, enabling users to set notification pop-up timings according to their travel distance to the stop should be made possible.
Get in touch for additional recommendations.
Predicted Impact
Based on the number of usability issues identified and based on the design recommendations provided, I expect to have the following impact;
Task Success Rate > 95% as compared to current the rate of 60% to 70%
Reduced confidence interval range as to wide current wide confidence interval range.
New SUS score of ~90 as compared to the current score of 55.5
Ridership and applications usage increase by ~40%
Key Takeaways
01.
Triangulating data is the key to a successful research study.
02.
Having a matrix to measure the design improvements based on the research study recommendations is as vital as the study itself.
03.
Breaking down research goals into observable objectives is the key to achieving focus in research studies.